GOVERN · REPORTS & DASHBOARDS
The compliance report writes itself.
Sentinel turns raw events and identity data into numbers an operator or an executive can act on — live KPI dashboards and heatmaps on screen, and scheduled reports that generate to PDF and CSV and email themselves to your recipient lists. Procurement-grade reporting that is auditable, not a black box.
 Click to enlarge
The numbers an operator or an executive can act on, on one screen.
The overnight picture, ready at handover.
The shift lead opens one report and knows what happened overnight — without replaying a single clip or reconstructing it by hand.
- Watchlist hits, weapon alerts, and loitering events for the period
- Top five cameras by event count — where the activity actually was
- A threat-dial summary that frames the night in one read
- Generated to PDF and CSV and waiting in the inbox before the shift starts
 Click to enlarge
The same numbers the live dashboard shows, packaged for the handover.
The report procurement asks for — on a schedule.
The standing pack a Data Protection Officer needs every week, assembled automatically so the compliance position is never reconstructed under pressure.
- Subject-access (SAR/DSAR) queue and SLA status — the 30-day clock with requests flagged at T-5 and T-1 days
- DPIAs expiring in the period — the per-camera assessments that need a fresh review
- Retention deletions executed — what aged out, proving the retention policy actually ran
- Breach-clock status — every open breach measured against the 72-hour notification deadline
- Audit-log size for the period — the volume of recorded activity, at a glance
A confident one-pager for the people upstairs.
The board summary for everyone who never opens the console — the month in the few numbers that decide a budget or a posture, in plain language.
- Total events for the period — the scale of what the network handled
- Top ten watched subjects — who mattered this month
- The mobility map and the top zones by activity — where attention concentrated
- AI-overlay availability per camera — an honest read of coverage, not a claim of total reach
- Rendered to a clean PDF for the pack, with the CSV attached for anyone who wants the rows
 Click to enlarge
The month in the handful of numbers that decide a budget or a posture.
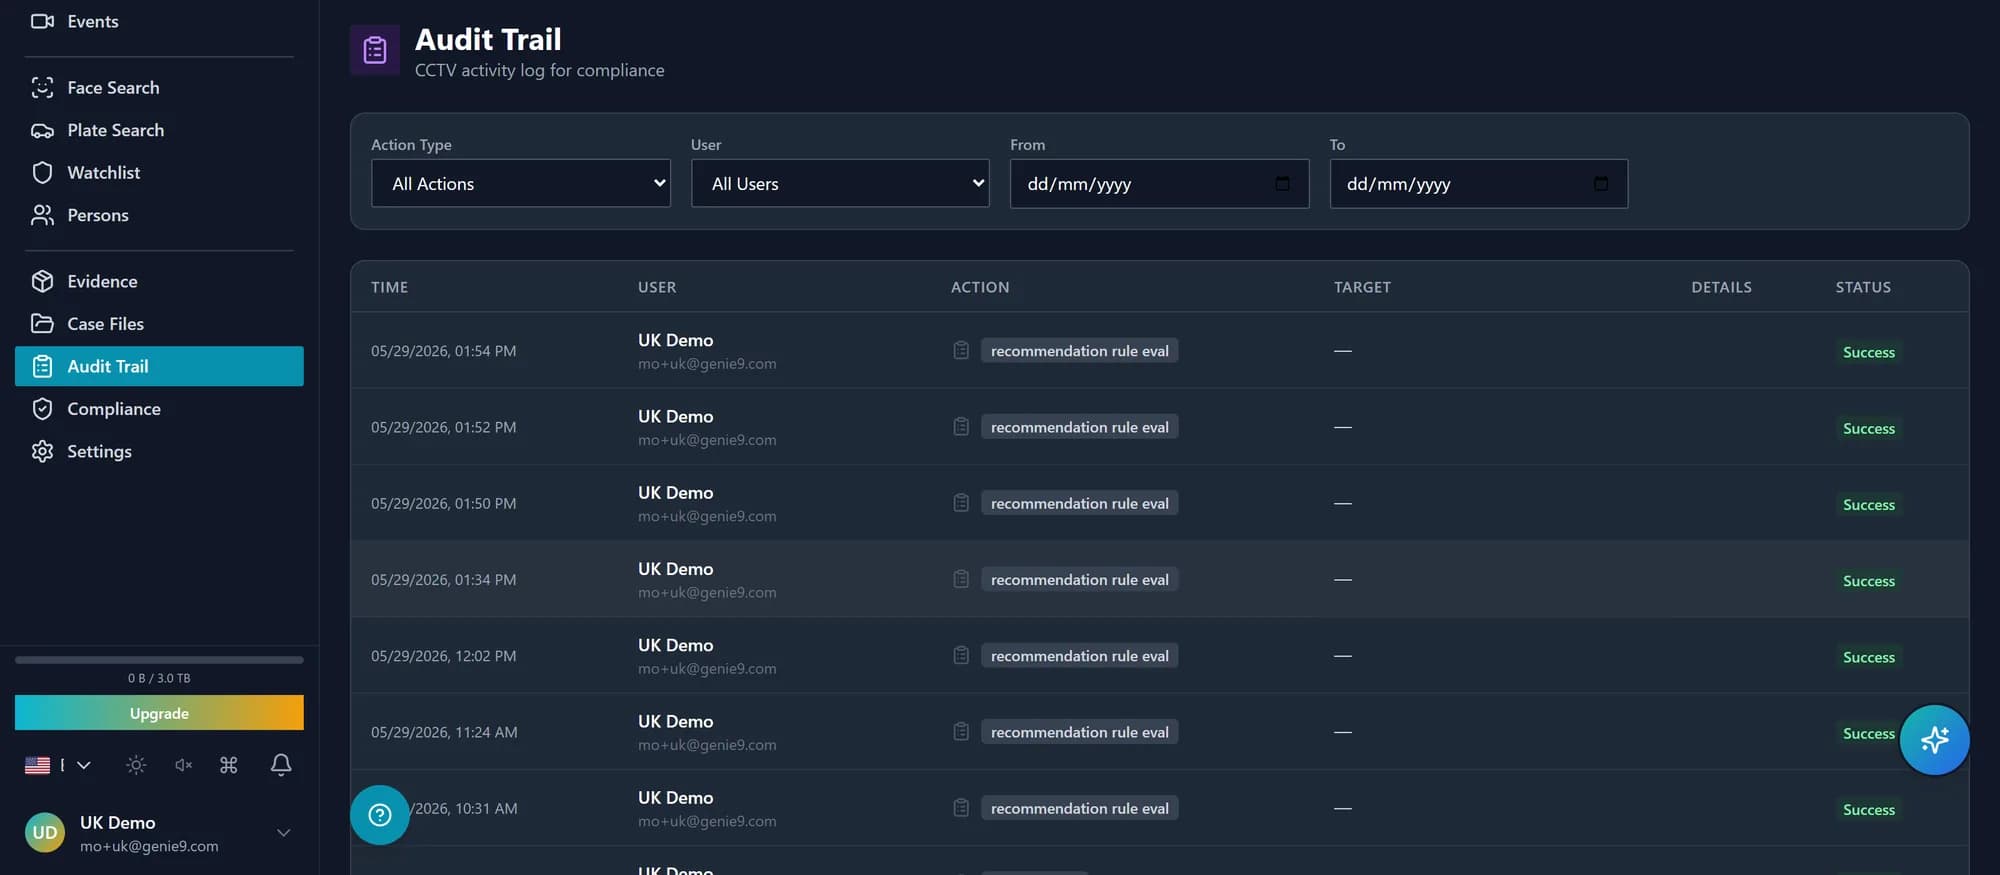
Suggestions you can explain to an auditor.
Sentinel surfaces deterministic, rule-based recommendations — ‘camera offline 36 min — escalate?’, ‘review zone coverage’ — each one traceable to the rule that fired it. No model guessing, nothing you cannot account for.
- Deterministic and rule-based, not generative — the same inputs always produce the same recommendation
- Plain-language and specific — ‘camera offline 36 min — escalate?’, not a vague score
- Per-recommendation action — acknowledge, dismiss, or snooze, with the decision recorded
- Every action audit-logged — what was recommended, who acted, and what they did
- Procurement-grade by design — a recommendation you can defend in a review, every time
What you get
The reporting surface, end to end.
Daily Operations
The overnight picture for the shift lead: watchlist hits, weapon alerts, and loitering events; the top five cameras by event count; and a threat-dial summary. The first thing read at handover.
Weekly Compliance
The DPO’s standing pack: the subject-access (SAR/DSAR) queue and its SLA status, DPIAs expiring, retention deletions executed in the period, audit-log size, and the breach-clock status. The report procurement asks for.
Monthly Executive
The board summary: total events for the period, the top ten watched subjects, the mobility map, top zones by activity, and AI-overlay availability per camera. A confident one-pager for people who never open the console.
PDF and CSV, every time
Each report renders to a clean PDF for the board pack and a CSV of the underlying rows for the analyst. One reads, one re-computes — so a number in the document can always be traced back to its data.
Localized output
Each scheduled report carries its own locale, so a report destined for a regional team or a regulator arrives in the right language without a separate configuration for each one.
Delivery on the record
Status is tracked per scheduled report and per delivery: when it ran, who it went to, and whether it landed. A failed send is visible, not silent — so the monthly pack never quietly stops arriving.
The live dashboards behind the reports
On screen, the same numbers — live.
See the whole operation at a glance — and drill in instantly.
One screen shows live action counters per category — each a one-click filter into the underlying records — with combined filtering by operator, action, resource, and time range, staying under 100 ms across a million-plus rows.
- Live counters per category — CCTV, SSO, Watchlist, Persons, Cases, SARs, Litigation
- Filter by operator, action, resource, and time range — combined, in milliseconds
- Sub-100 ms at a million-plus rows; no spinner, no slow aggregate scan
- KPI strips and heatmaps share the same data — the geographic heatmap stays sub-50 ms at 1.2M events
Click to enlargeFilter to a single operator’s actions in milliseconds, then schedule it as a report.
How it works
From a live number to a report that emails itself.
Define the report and its recipients
Pick a template — Daily Operations, Weekly Compliance, or Monthly Executive — set the cadence and locale, and name the recipient list. The list is just email addresses, so a report can reach people who never log in to the console.
Cron runs it on schedule
At the appointed time a scheduled job assembles the report from the same analytics endpoints the live dashboards use — time-bucketed event counts, heatmap aggregates, the audit roll-ups — so the document and the screen always agree.
Rendered to PDF and CSV, emailed out
Each run produces a board-ready PDF and a CSV of the underlying rows, then delivers them to the recipient list through the integrated mail pipeline. No one has to remember to export anything.
Every run is tracked and provable
The schedule keeps a row per run and a row per delivery — when it fired, where it went, and whether it succeeded. The compliance pack arrives on its own, and you can prove it did.
Under the hood
Specifications
| Scheduled cadences | Daily Operations · Weekly Compliance · Monthly Executive, per organization |
| Report templates | Daily ops (hits, weapon alerts, loitering, top-5 cameras, threat-dial summary) · Weekly compliance (SAR/DSAR queue + SLA, DPIAs expiring, retention deletions, audit-log size, breach status) · Monthly executive (total events, top-10 watched subjects, mobility map, top zones, AI-overlay availability per camera) |
| Output formats | PDF (board-ready) + CSV (underlying rows) on every run |
| Delivery | Emailed to a per-report recipient list through the integrated mail pipeline; per-report locale |
| Execution | Run via cron on the configured cadence; status tracked per scheduled-report row and per-delivery row |
| KPI strips | Watchlist, Persons, and Command Center stat rows; each tile soft-fails independently and is a one-click filter |
| Heatmaps | Geographic event-density heatmap (sub-50 ms at 1.2M events via a covering index) + per-person 7×24 pattern-of-life heatmap |
| Charts | 24-hour hourly activity chart with watchlist-hit overlay, sparklines, per-camera analytics, threat-level history |
| Audit dashboard | Live counters per category (CCTV / SSO / Watchlist / Persons / Cases / SARs / Litigation); filter by user, action, resource, and time range in under 100 ms across a million-plus rows |
| AI recommendations | Rule-based and deterministic (not LLM); per-recommendation acknowledge / dismiss / snooze; every action audit-logged |
| Compliance SLAs surfaced | SAR/DSAR 30-day SLA with T-5 and T-1 flags; 72-hour breach-notification clock — both reported in the Weekly Compliance pack |
Specifications describe shipped platform capabilities; we'll confirm the cadences and recipient lists that fit your deployment during your demo.
Stays in the Govern set
Reports are one part of accountability.
Audit & Accountability
The tamper-evident record behind the dashboard: every operator action hashed into a chain, anchored hourly to write-once storage, and independently recomputable from the records alone.
Learn moreCompliance & Privacy
The DPO toolkit the Weekly Compliance report draws from: lawful basis with expiry, per-camera DPIA, subject-access export and erase, retention policies, and the breach workflow that tracks the clock.
Learn moreBriefing Mode
The auto-generated intelligence brief at every shift start — the headline, what changed overnight, the day’s top actions, and the audit anomalies worth a closer look.
Learn moreLet the compliance report write itself.
Request demo access and we’ll send you a private, pre-loaded environment. Schedule a Weekly Compliance pack, watch it render to PDF and CSV, and see the audit dashboard filter a million rows in milliseconds — procurement-grade reporting, on live data.